
Lead Generation ROI: How to Measure and Improve It
Most advice about lead generation ROI starts in the wrong place. It tells you to lower cost per lead, increase form completions, and shift budget toward the channel with the cheapest acquisition cost. That approach can make a dashboard look healthier while revenue gets weaker.
A lead-generation campaign is a chain of handoffs. Paid traffic must survive the landing-page load, form interaction, validation, CRM delivery, response process, qualification, sales acceptance, and attribution window. A leak at any stage can erase the apparent gain from the stage before it. The useful question isn't “How cheaply did we create a lead?” It's “How much revenue did each accepted lead produce after every cost and failure point was counted?”
A widely used historical B2B benchmark places healthy lead-generation ROI in the 3:1 to 5:1 range, or $3 to $5 in revenue for every $1 invested, as summarized by Prospeo's lead-generation cost benchmark. That's a useful reference point, not a universal target. Insurance, solar, home services, and B2B services have different sales cycles, margins, acceptance rules, and customer values.
Table of Contents
Table of Contents
- Why Cost Per Lead Is the Wrong Starting Point for ROI
- The Core Formulas Behind Lead Generation ROI
- The Five Metrics That Actually Move the Number
- Vertical Benchmarks and Where the Money Goes
- Where Lead Value Quietly Leaks Out
- Capture-Layer Tactics That Lift ROI in Practice
- Tracking and Attribution as an ROI Lever
- A 30-Day Plan to Lift Lead Generation ROI
Why Cost Per Lead Is the Wrong Starting Point for ROI
A low CPL doesn't prove that a campaign works. It proves only that the campaign generated submissions at a particular media cost.
Consider a solar campaign producing leads at $45 each. That figure might look efficient until the sales team accepts only a minority of submissions, buyers reject weak records, and qualification requires manual labor. If the campaign attracts people outside the service area, below the budget threshold, or unable to verify their contact details, the advertiser has paid for activity that can't become revenue.
The correct unit isn't the raw lead. It's the accepted lead, or the opportunity that meets the buyer's definition of usable. A practical version of the calculation is:
Lead generation ROI = (Revenue per accepted lead × acceptance rate − CPL − qualification cost) ÷ total acquisition cost
That formula changes the operating conversation. A campaign can have an attractive CPL and poor accepted-lead economics, while another campaign with a higher CPL can produce stronger revenue because its targeting, form questions, and routing create a better sales queue.
Practical rule: Optimize toward accepted-lead revenue, not the cheapest possible submission.
This matters particularly in lead-aggregation businesses. Under-50-employee firms average about $146 per lead, while enterprise companies average about $429 per lead, according to the Prospeo benchmark cited above. The difference reflects scale and operating complexity, but it also shows why a CPL target copied from another business can mislead your budget decisions.
The leak-first way to diagnose a campaign
Start by mapping the path from click to revenue:
- Capture: Did the visitor complete the form?
- Validity: Can sales reach the person, and is the data accurate?
- Delivery: Did the submission reach the CRM or buyer without delay?
- Acceptance: Did the receiving team consider it qualified?
- Conversion: Did it become an opportunity, sale, or retained customer?
- Attribution: Did the reporting system connect the outcome to the right source?
The rest of the analysis should follow those leaks. Lowering CPL is useful only when it doesn't damage acceptance, sales capacity, or customer value.
The Core Formulas Behind Lead Generation ROI
The basic calculation is straightforward:
ROI = (Revenue − total spend) ÷ total spend
If you want a percentage, multiply the result by 100. Include media, creative, landing-page work, software, agency costs, and the labor required to qualify and route leads. A media-only calculation often exaggerates performance because it leaves the capture and sales operation outside the denominator.
For lead generation, the more useful version starts with accepted leads:
Expected revenue per raw lead = revenue per accepted lead × acceptance rate
Then compare that expected value with CPL and qualification cost. This separates the economics of attracting a submission from the economics of producing something the sales team or buyer can use.
EPC adds the click-level view
Earnings per click, or EPC, tells you how much revenue each ad click generates after the landing page and form do their work. It connects media buying to post-click performance:
EPC = revenue ÷ clicks
A campaign with $4 EPC and a 22% landing-page conversion rate can be more productive than a campaign with $6 EPC and a 5% conversion rate, depending on click cost, lead acceptance, and the value assigned to each conversion. EPC alone isn't enough, but it exposes whether the landing page is converting the traffic you bought.
For a $40,000 monthly insurance budget, build the calculation in layers:
- Divide spend by clicks to establish the paid-traffic volume.
- Apply landing-page conversion to estimate submissions.
- Apply validation and acceptance rates to estimate usable leads.
- Multiply accepted leads by expected revenue or customer value.
- Subtract media, platform, qualification, and sales costs.
- Compare the result with the same campaign under a consistent attribution window.
Don't let Meta, Google, GA4, and the CRM each define “conversion” differently. Before changing bids, measure marketing impact with a shared definition of spend, revenue, and attribution. For a quick planning model, a lead-generation ROAS calculator can help you test break-even assumptions before committing budget.
Three ROI lenses applied to the same campaign
| Lens | Formula | Example output | What it hides |
|---|---|---|---|
| Basic ROI | (Revenue − spend) ÷ spend |
A single return multiple | Qualification, sales cost, and delayed revenue |
| Accepted-lead ROI | (Revenue per accepted lead × acceptance rate − CPL − qualification cost) ÷ spend |
A funnel-adjusted return | Attribution across multiple touchpoints |
| Attribution-adjusted ROI | Attributed revenue within the chosen window ÷ total cost |
A source or campaign return | The model's assumptions and unobserved influence |
The right lens depends on the decision. Use basic ROI for a high-level financial view, accepted-lead ROI for campaign operations, and attribution-adjusted ROI when reallocating budget across channels.
Email deserves separate treatment because it often supports both acquisition and nurture. Benchmark summaries report roughly $36 to $42 returned for every $1 spent on email marketing, while average B2B website visitor-to-lead conversion sits around 2.5% to 3% and only about 13% of leads become qualified opportunities, according to Tomba's B2B lead-generation statistics. The lesson is simple: revenue appears downstream, so the formula must follow the lead beyond the form.
The Five Metrics That Actually Move the Number
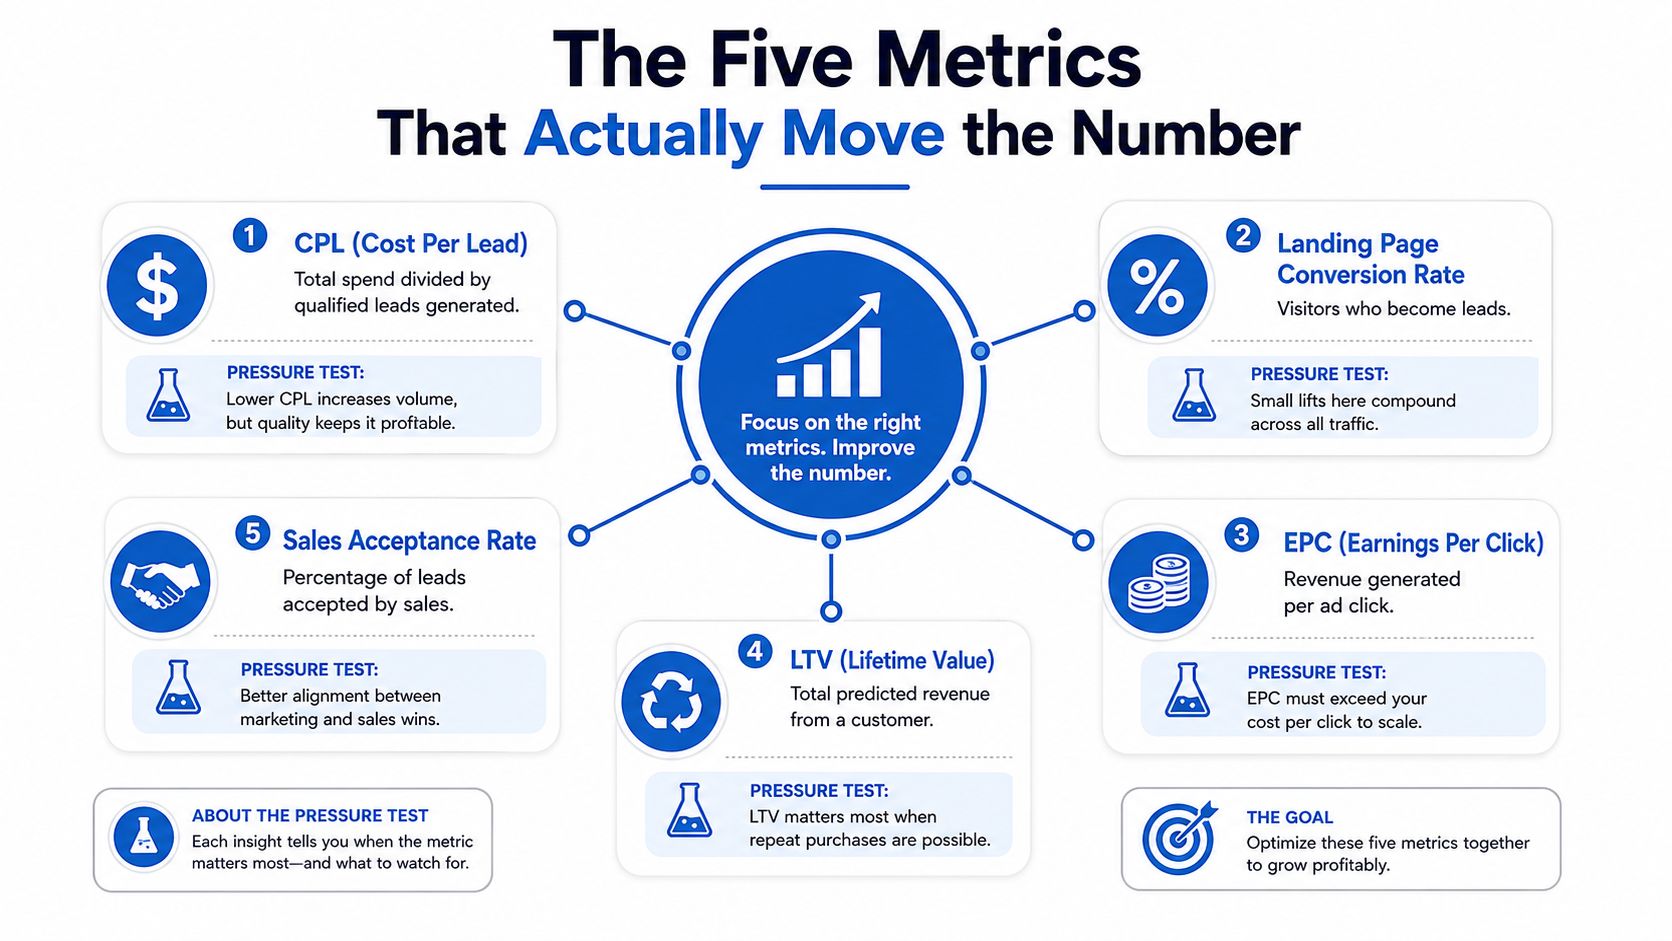
A useful ROI dashboard has fewer vanity metrics and more measures tied to the sales outcome. Five metrics usually explain where the money is moving: CPL, landing-page conversion rate, EPC, LTV, and sales acceptance rate.
CPL is total spend divided by leads generated. It helps monitor media efficiency, but it treats every submission as equally valuable. A cheap lead with an invalid phone number is not equivalent to a verified lead that sales accepts.
Landing-page conversion rate measures the share of visitors who become leads. It diagnoses capture friction, message match, page speed, and form design. Improving it can increase lead volume from the same traffic, but an aggressive optimization that removes qualifying questions can also lower acceptance.
EPC is revenue generated per click. It gives paid media teams a stronger post-click signal than clicks or form submissions alone. The relationship is also visible in ROAS: if the campaign receives 100 clicks for every unit of spend, then ROAS equals EPC multiplied by 100, provided EPC and the spend basis use compatible units.
LTV estimates total customer value over the relationship. It matters when customers renew policies, upgrade software, buy additional services, or sign ongoing home-services contracts. A channel that produces fewer first purchases can still be valuable if it attracts customers with stronger retention or expansion potential.
Sales acceptance rate is the percentage of leads that sales or a buyer accepts as usable. In affiliate-driven lead businesses, this is often the silent killer. Marketing can increase form conversion while the sales queue becomes less valuable.
Pressure-test the metrics together
A common mistake is to maximize landing-page conversion while ignoring acceptance. If a shorter form doubles submissions but halves the qualified pipeline, the campaign has bought more work, not more revenue.
Use these relationships:
- Revenue per lead = LTV minus CAC.
- Expected accepted-lead value = accepted-lead revenue × acceptance rate.
- Effective acquisition cost = media and qualification spend ÷ accepted leads.
Reviewing sales candidate assessment metrics alongside marketing metrics helps expose the handoff problem. If marketing reports rising conversion and sales reports falling acceptance, neither team should optimize in isolation. The form, qualification rules, routing, and sales definition need to be evaluated as one system.
Vertical Benchmarks and Where the Money Goes
Vertical comparisons are useful only when they respect the product being sold. A solar lead, a legal inquiry, and a B2B demo request may all begin with a form submission, but their economics differ because deal value, sales effort, compliance requirements, and buying timelines differ.
The verified benchmark data available here doesn't establish reliable CPL ranges, average LTVs, or acceptance rates for each vertical. That means a table filled with invented “typical” numbers would create false precision. Use the following framework instead, then populate it with your own CRM and buyer data.
Typical CPL ranges by vertical
| Vertical | Typical CPL range | Average customer LTV | Acceptance rate | Primary cost driver |
|---|---|---|---|---|
| Insurance | Establish from accepted-lead and policy data | Segment by policy and renewal value | Buyer and carrier rules | Verification, compliance, and follow-up |
| Solar | Establish from accepted-lead and installed-customer data | Include installation and upgrade value | Service area and homeowner qualification | Long sales process and appointment quality |
| Home services | Establish by trade and job type | Separate one-off jobs from contracts | Geography, urgency, and job fit | Local intent and dispatch capacity |
| Legal | Establish by matter type and buyer disposition | Segment by case economics | Practice-area and case qualification | Qualification intensity and compliance |
| Financial services | Establish by product and funded outcome | Use funded-account value | Credit, geography, and product fit | Regulatory screening and verification |
| B2B SaaS | Establish by opportunity and closed-won data | Include retention and expansion | MQL, SQL, and opportunity definitions | Longer cycle and sales labor |
For context, benchmark summaries report B2B visitor-to-lead conversion at about 2.5% to 3% and qualified-opportunity conversion at around 13%, as noted by Tomba. Those figures are directional, not a replacement for vertical-specific acceptance data.
A $250 solar lead and a $35 legal lead aren't comparable products simply because both came through a social form.
To locate your position, calculate CPL beside cost per accepted lead, EPC, sales acceptance, and customer value. If accepted-lead cost is high but EPC is healthy, the capture or qualification layer may be inefficient. If CPL is low and accepted-lead revenue is weak, the problem is more likely targeting, buyer fit, or sales conversion.
Where Lead Value Quietly Leaks Out
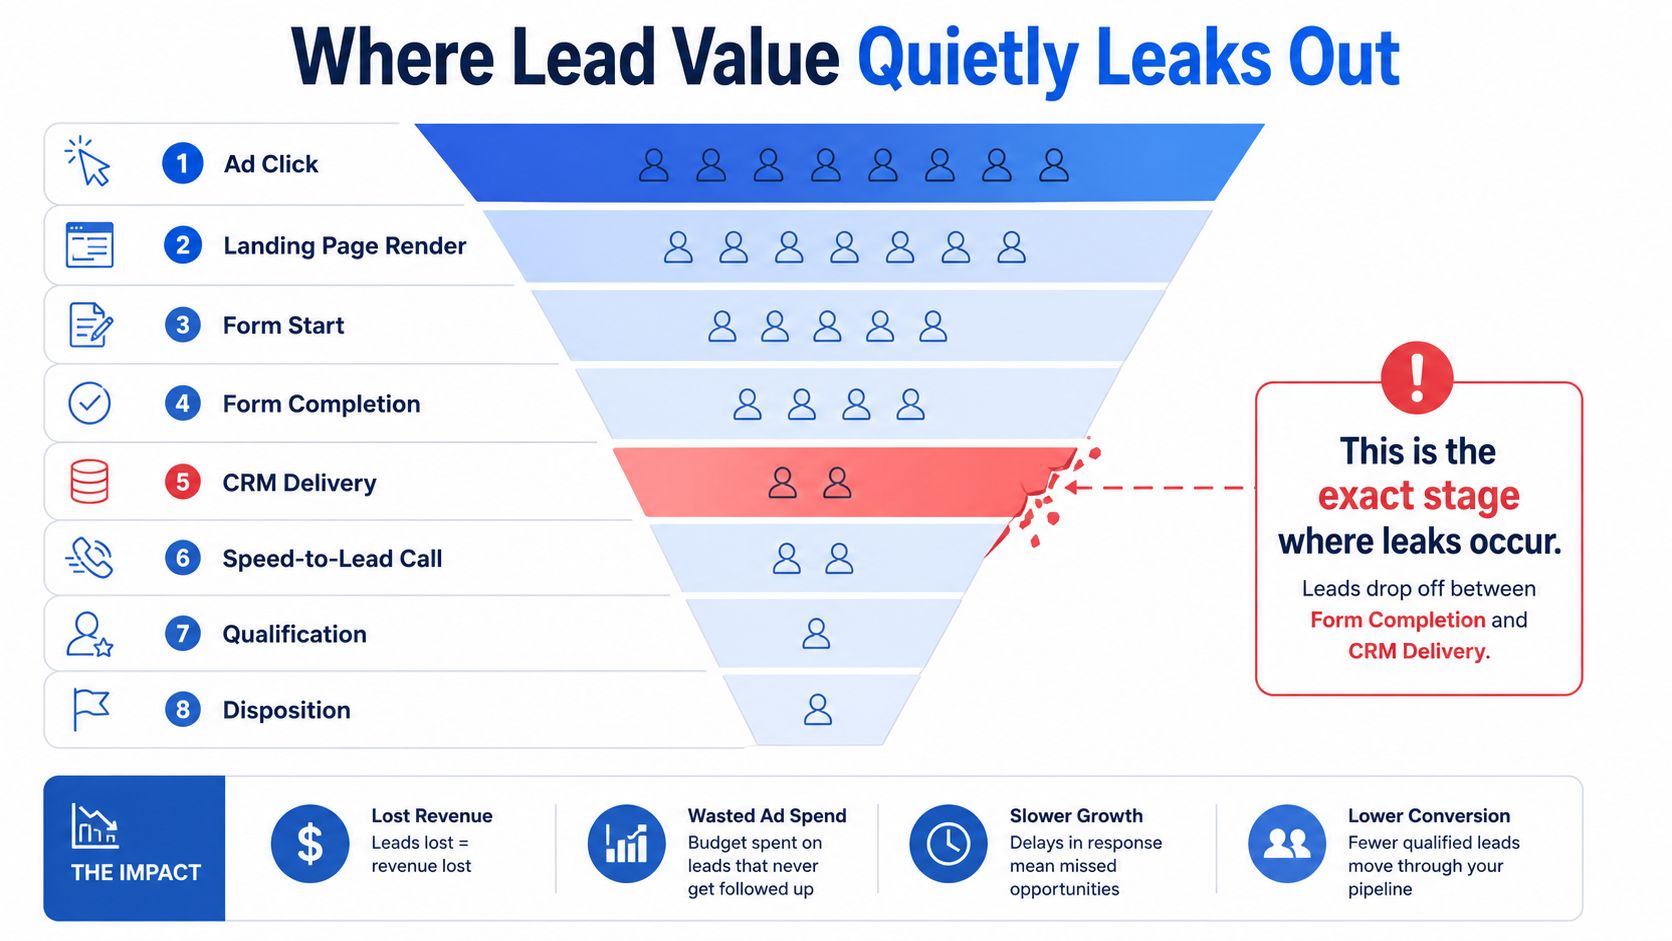
A paid lead begins as a click, not as revenue. The operator pays for the click, waits for the landing page to render, asks for information, validates the record, delivers it to a CRM or buyer, and depends on someone to respond. Every transition creates a place where value can disappear.
The most visible leak is form abandonment, especially on mobile. Long forms create perceived friction, while slow pages and unclear progress make the visitor uncertain about the effort required. Splitting the same field count across two to three steps lifted completion by 14% on average and by 21% for lead-generation forms, according to the 2026 form-conversion benchmark review.
Follow one submission through the stack
A useful audit traces one record through every stage:
- Ad click: The source, campaign, and click ID must persist.
- Landing-page render: The page must load and display the promised offer.
- Form start: The first question must feel easy enough to answer.
- Form completion: The visitor must finish without confusion or unnecessary friction.
- CRM delivery: The submission needs to arrive with complete fields and consent evidence.
- Speed-to-lead call: A human or automated workflow must initiate contact quickly.
- Qualification: The team confirms need, fit, location, budget, and intent.
- Disposition: The CRM records accepted, rejected, booked, sold, or lost.
Data can fail even after the visitor clicks submit. Invalid email addresses, unreachable phone numbers, duplicate records, and broken webhook responses can leave sales with a lead that never becomes actionable. If the CRM receives the record but the buyer doesn't, the advertising platform may still report a conversion while the business receives no economic value.
Speed is another second-order lever. Research summarized in a sales enablement paper reports a 391% conversion improvement when the response occurs within 1 minute, while calling within 30 minutes increased conversion by 62% and within 1 hour by 36%, as detailed in CapConvert's form-optimization research. Treat sub-five-minute response as an operating floor and track submission-to-contact timestamps.
For a practical audit of response handling, use these time-to-lead benchmarks alongside CRM disposition data.
Capture-Layer Tactics That Lift ROI in Practice
The capture layer should repair the earliest leaks without destroying qualification depth. Sequence the work so each intervention has a defined metric and a clear owner.
Start with mobile friction
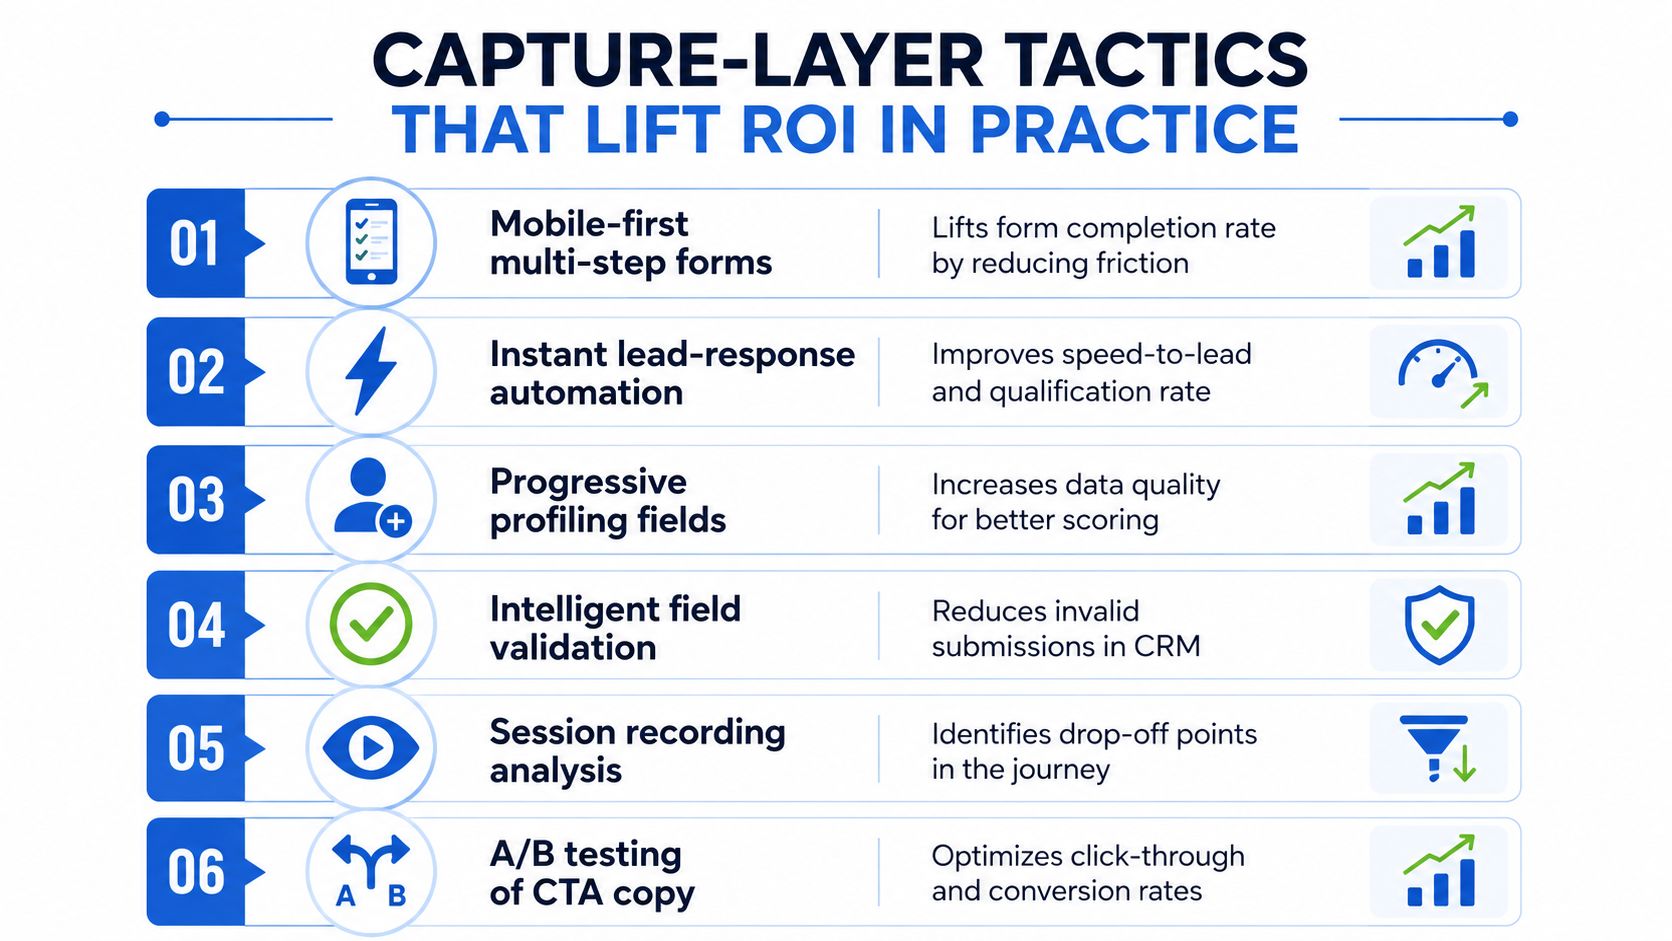
Use a multi-step form when the qualification flow is long. Show progress, disclose questions gradually, and use conditional branching so a visitor doesn't answer fields that don't apply. The verified benchmark indicates that a 21% completion lift for lead-generation forms is possible when the same field count is split across steps, with the largest opportunity appearing where intent is high and form friction is substantial.
Then add real-time validation for phone and email at the point of submission. This is not a promise of a universal lift, but it can protect acceptance by stopping obvious junk, duplicates, and unreachable contacts before they enter the sales workflow.
Add qualification without adding abandonment
Use conditional disqualification for clear mismatches, such as an out-of-area visitor or a prospect below a buyer's minimum criteria. The trade-off is deliberate: you may generate fewer raw leads, but sales receives a cleaner queue and the buyer's acceptance rate can improve.
Progressive profiling works well for returning visitors. Capture the minimum useful information first, then ask for additional context later, rather than forcing every visitor through the same long intake.
Fix delivery and response
A routing webhook should fire on submission and send the lead to the CRM, dialer, distribution platform, or alert workflow immediately. Store the event timestamp, delivery status, buyer response, and sales disposition. This lets you distinguish a media problem from a handoff problem.
Test SMS and call sequences separately. The winning workflow isn't necessarily the one with the highest contact rate. It must also produce accepted conversations, booked appointments, and revenue.
A no-code capture tool such as Growform can build multi-step and quiz-style forms, apply conditional logic and disqualification, preserve UTM and click-ID fields, validate contact details, and deliver submissions through webhooks to CRMs and lead-distribution systems. Use it as a capture-layer option alongside your existing CRM, dialer, and attribution stack, not as a replacement for downstream revenue tracking.
Keep the measurement edge clean
Persist source, medium, campaign, sub-IDs, and click IDs through the entire flow. Send qualified outcomes back to ad platforms where possible, and use session recordings or form analytics to locate abandonment rather than guessing from aggregate CPL.
The implementation order is usually:
- Mobile UX: Reduce perceived friction first.
- Validation: Protect lead quality at submission.
- Logic: Remove obvious non-buyers early.
- Routing: Deliver records in real time.
- Follow-up: Test contact sequences against accepted outcomes.
- Attribution: Preserve the fields needed to connect lead to revenue.
Tracking and Attribution as an ROI Lever
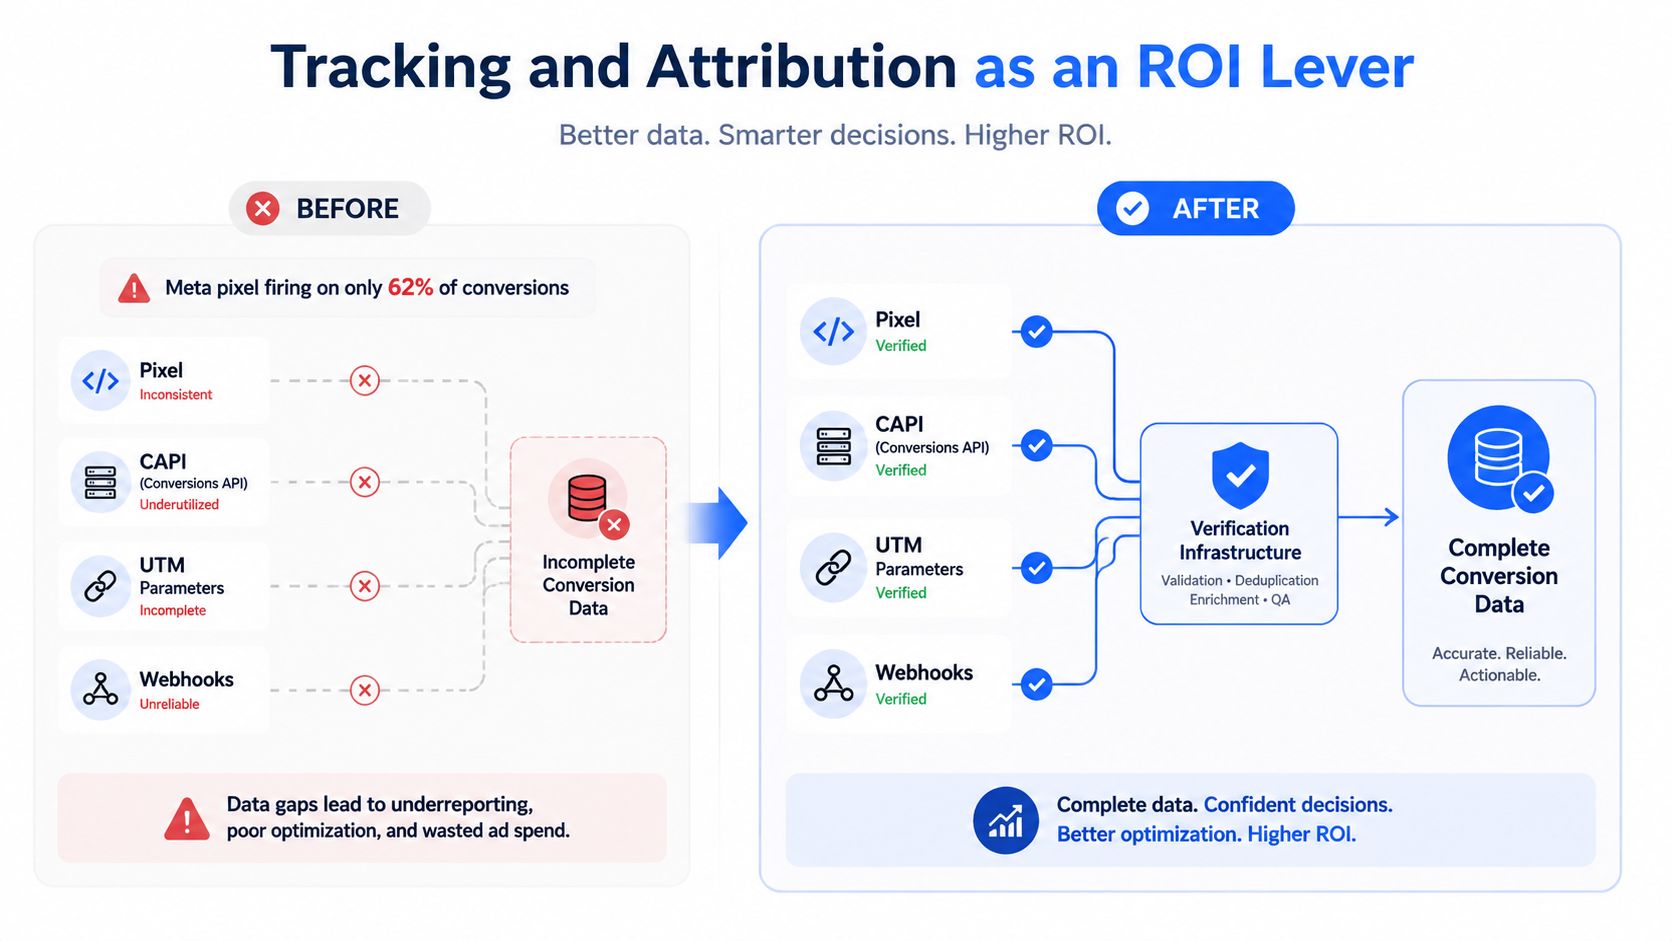
Tracking isn't back-office hygiene. It determines which campaigns receive budget, which audiences get tested, and which leads sales follows up with first.
A broken pixel can make a weak campaign appear profitable or make a productive campaign appear unscalable. Last-click reporting also tends to reward the final interaction while hiding earlier touches that created intent. In longer buying cycles, a short measurement window can understate return. Independent attribution research reports 15% to 30% higher marketing ROI among companies using attribution effectively, while WARC and Google data summarized by Omnibound's attribution statistics shows short-term ROI rising from £1.87 per £1 spent to £4.11 when long-term effects are counted, a 120% lift from extending the measurement window.
Build the event chain
A dependable stack connects the browser, server, ad platform, and CRM:
- GA4 server-side container: Reduces dependence on fragile browser-only signals.
- Meta Conversions API: Sends server-side events with a shared
event_idfor deduplication. - Google Enhanced Conversions: Improves matching using consented first-party data.
- Offline conversion uploads: Return accepted, qualified, opportunity, and closed-won statuses to the ad platform.
- UTM governance: Audit source, medium, campaign, content, and term naming every week.
- CRM webhooks: Push timestamped status changes back into the reporting layer.
Use campaign attribution guidance to define the source-of-truth rules before launching another test. The important point isn't choosing a fashionable attribution model. It's making sure the same lead retains its identity from click through disposition.
Judge the rebuild by recovered economics
Track the line item each fix affects:
- A missing click ID creates unattributed revenue.
- Duplicate events distort campaign optimization.
- Broken webhooks delay contact and reduce lead value.
- Missing dispositions prevent accepted-lead ROI.
- Short attribution windows undervalue nurture and delayed sales.
Keep multiple views in the dashboard. Last click can support quick operational decisions, while a longer attribution window can help evaluate channels whose revenue arrives later. Don't combine the outputs into one supposedly precise number. Label each view, document its rules, and compare trends consistently.
A 30-Day Plan to Lift Lead Generation ROI
The fastest path to better ROI usually starts with measurement, not a new ad creative. Fix the data and handoff problems that prevent you from seeing which campaigns produce accepted revenue, then improve the capture experience.
Week one, repair the measurement foundation
Audit UTMs, click IDs, duplicate events, CRM source fields, and offline conversion statuses. Confirm that every submission has a campaign identity and a recorded disposition. Establish baseline EPC and sales acceptance by source before moving budget.
Week two, rebuild the capture layer
Review mobile form recordings and abandonment points. Split longer flows into progressive steps, add a visible progress indicator, and validate contact details before submission. Keep the qualification inputs that sales needs, but use conditional logic to avoid irrelevant questions.
Week three, tighten the handoff
Set a sub-five-minute response SLA. Fire webhooks on submission, route accepted records to the right closer or buyer, and log the timestamps for submission, delivery, first contact, qualification, and disposition. Remove obvious non-buyers before they consume sales capacity.
Week four, close the loop
Upload offline outcomes, recalculate ROI over the correct attribution window, and compare sources by accepted-lead revenue rather than raw lead count. Reinvest in the strongest sources and pause campaigns that remain unprofitable after capture, qualification, and routing fixes.
A worked scenario can show the direction of change. Suppose a campaign starts at $65 CPL, 45% acceptance, and $310 EPC, then reaches $72 CPL, 68% acceptance, and $395 EPC after the fixes. At the same ad spend, the stated scenario moves ROI from 2.15x to 2.74x because the campaign creates more valuable accepted outcomes, even though CPL rises.
30-day ROI recovery plan
| Week | Focus | Primary metric moved | Before | After |
|---|---|---|---|---|
| Week 1 | Tracking and source integrity | Attribution-adjusted ROI | Fragmented | Unified |
| Week 2 | Mobile capture and validation | Form completion and valid-lead rate | Baseline | Improved |
| Week 3 | Routing and follow-up | Speed-to-lead and acceptance | Delayed | Sub-five-minute SLA |
| Week 4 | Offline outcomes and budget allocation | EPC and ROI | Media-level view | Accepted-revenue view |
Don't judge the plan by how many tickets were closed or dashboards were created. Judge it by whether accepted leads, EPC, contact speed, and attributed revenue move in the right direction.
If mobile abandonment, weak qualification, broken tracking, or slow delivery is limiting your lead generation ROI, Growform gives performance teams a no-code capture layer for multi-step forms, conditional logic, verification, UTM pass-through, and real-time CRM or buyer delivery. Visit Growform to assess whether rebuilding the form and handoff layer can improve the economics of your next paid campaign.