
Conversion Rate Benchmarks 2026: A Complete Guide
 Harvey Carpenter Updated 11 min read
“Good conversion rates are between X and Y.” That's the advice most benchmark articles offer, and it's usually the wrong place to start. A conversion rate only means something when you know what converted, which visitors counted in the denominator, where they came from, and whether the resulting leads were worth selling or pursuing.
A dedicated paid-search landing page, a general website, and a form completion report measure different parts of the funnel. Treating them as interchangeable can send a team toward the wrong fix. The page may not need a new headline. The traffic may be poorly matched, the form may be too demanding on mobile, or the team may be comparing all visitors with only engaged form starters.
Why most conversion rate benchmarks mislead performance marketers
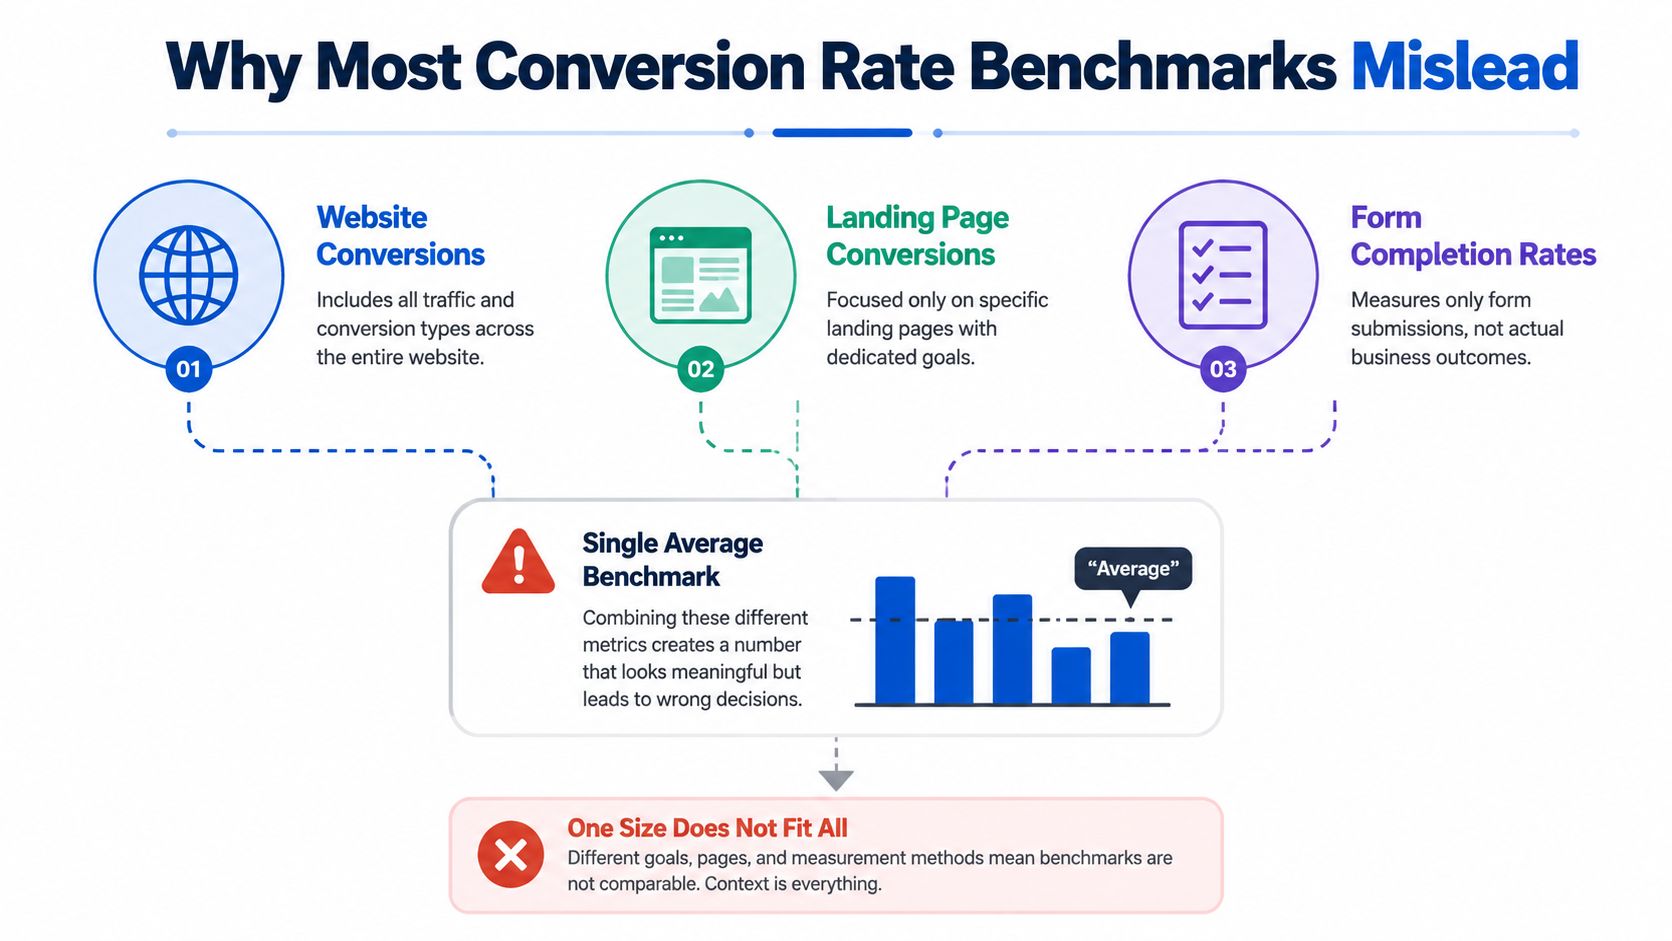
Most benchmark articles answer “What is the average?” before defining what was measured. That reverses the decision process. Website conversion rate, landing-page conversion rate, and form completion rate describe different funnel stages, so their percentages cannot serve as interchangeable targets.
A website rate usually divides completed goals by broad site traffic. A dedicated landing-page rate measures one offer and one action. A form completion rate may include only visitors who began entering information. The denominator changes the result before copy, design, or traffic quality enters the discussion.
For example, a website conversion rate of 4% may be reasonable across mixed-intent visitors, while a dedicated landing page at the same rate can fall below the 6.6% median in Unbounce's Conversion Benchmark Report, based on 41,000 landing pages, 464 million visitors, and 57 million conversions. Neither percentage proves that the funnel is healthy or broken. The comparison is meaningful only when the page type, conversion event, traffic source, and denominator align.
Start with the funnel stage
Track three separate rates:
- Website conversion rate: completed goals divided by all relevant website sessions or users.
- Landing-page conversion rate: submitted leads divided by visits to the dedicated page.
- Form completion rate: submitted forms divided by visitors who started the form.
The third figure often appears higher because it excludes visitors who never engaged with the form. Comparing it with a landing-page rate based on every visitor can hide the failure point. A page may attract qualified visitors who abandon the form, or a form may perform well with starters while paid traffic brings people who never intend to submit.
What the benchmark is really for
Benchmarks are directional controls, not universal targets. Use them to identify performance within a comparable range, results materially below that range, or unusual outcomes that warrant a tracking and lead-quality review.
Before changing button copy, check traffic source, device mix, offer intent, page type, and form stage. An aggregate rate can combine a strong desktop funnel with a weak mobile experience, or a productive search campaign with poorly matched social traffic. The benchmark narrows the investigation. It does not select the fix.
The core benchmark numbers that actually matter for lead generation
The useful benchmark is tied to the funnel stage being measured. For dedicated landing pages, Unbounce's 6.6% median conversion rate across all industries, drawn from its 2024 report, is a practical reference point. It describes completed landing-page conversions, not every website visit, form interaction, or sales-qualified lead. Apply it only when the page has a focused offer and a defined conversion action.
Industry context changes the baseline sharply. The same dataset placed SaaS at a 3.8% median and events and entertainment at 12.3%. A demo request usually carries more friction than an event registration, so identical targets would distort budget and page decisions.
Use a performance ladder, not a single target
Other benchmark round-ups quote a lower median for websites overall and a higher one for dedicated landing pages, with the top 10% of landing pages in double digits. Those figures come from different samples, so combining them with Unbounce's result would create false precision.
| Funnel context | How to interpret the result |
|---|---|
| General website | Broad traffic and multiple goals make lower rates normal |
| Dedicated landing page | Compare against landing-page data, offer intent, and vertical |
| Top-performing landing page | Results above roughly 11% merit a review of traffic quality, offer fit, and tracking |
| Lead-generation form | Separate page visits, form starts, completed submissions, and qualified leads |
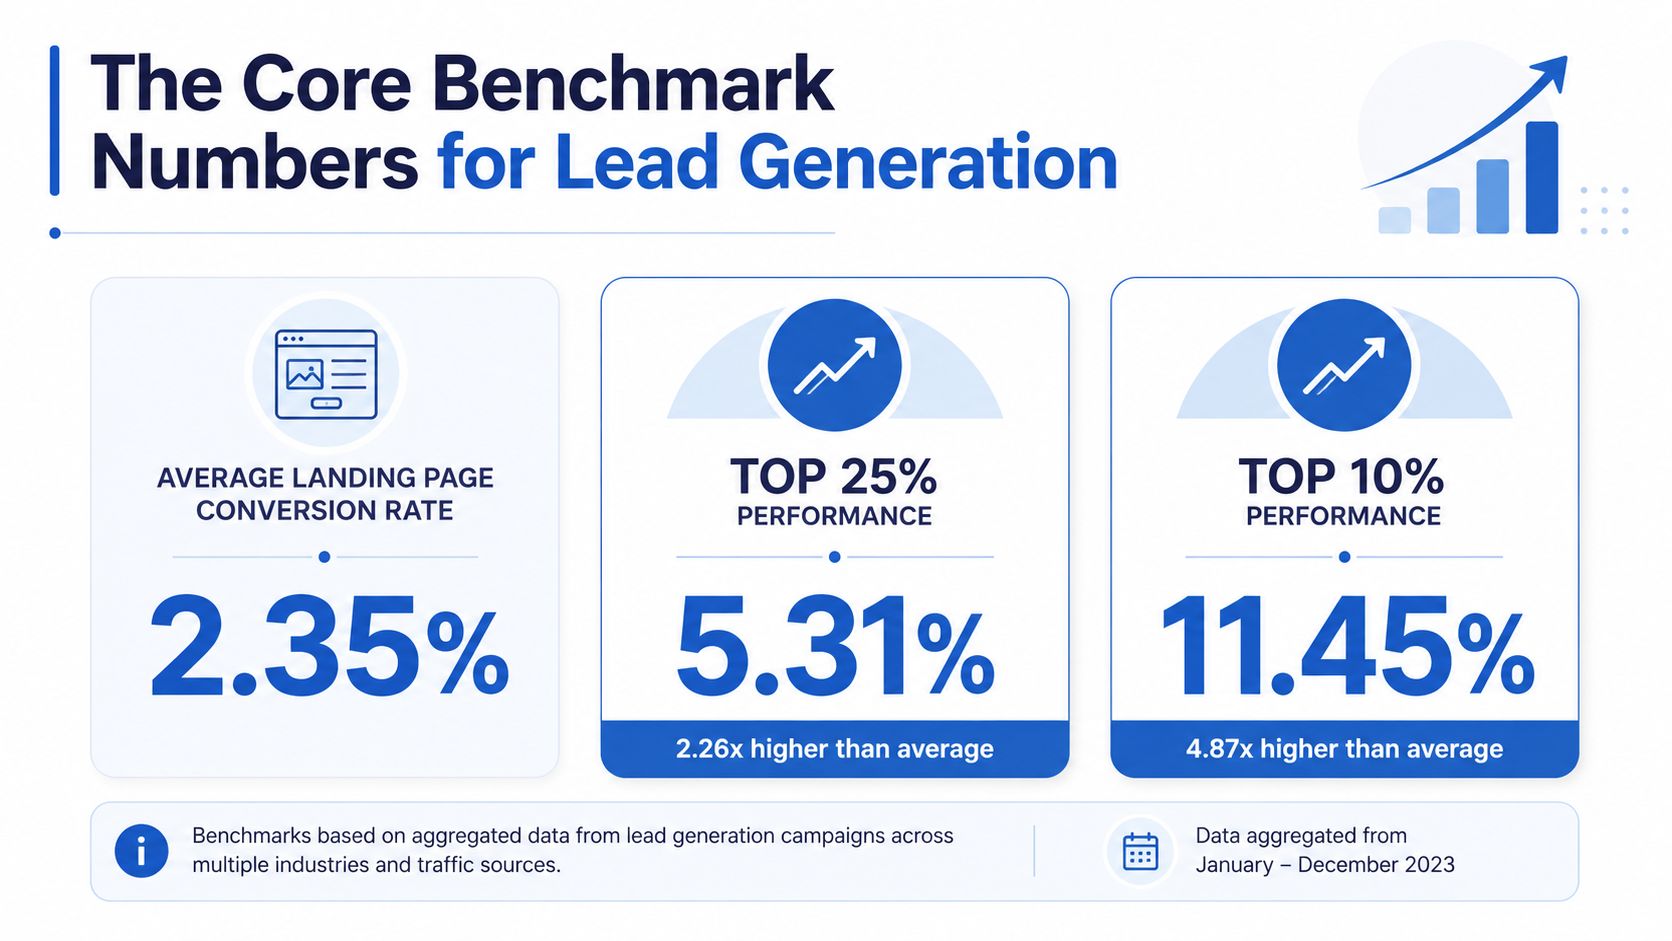
WordStream's analysis of Google Ads accounts put the average landing page at 2.35%, the top quarter at 5.31% and the top 10% at 11.45% or higher. Results below roughly 3% justify checking traffic quality and page friction first. That threshold identifies a review point, not a diagnosis.
Use Growform's guide to landing page metrics to define the supporting measures. Form-start rate shows initial engagement. Completed-lead rate shows submission efficiency. Qualified-lead and accepted-lead rates connect conversion volume to sales value. Each answers a different operational question, so keep them separate in reporting.
Conversion rate benchmarks by vertical and traffic source
Universal averages answer the wrong question. Insurance, legal, solar, home services, and B2B software involve different urgency, trust requirements, qualification, and sales friction. A branded-search visitor and a cold social visitor should not share one expected conversion rate, even within the same vertical.
The clearest vertical figures in the available data are for SaaS and events. Unbounce reported a 3.8% median for SaaS and 12.3% for events and entertainment across its landing-page dataset. These figures work as directional anchors, not targets. Your own benchmark still needs to account for the offer, audience, device mix, and funnel stage.
Traffic source creates another major split. Ruler Analytics' 2026 dataset of more than 5 million conversions reported paid search at 5.4%, AI referral at 5.8%, social organic at 2.23%, and social paid at 2.11% (Ruler Analytics' conversion-rate coverage). Search visitors often arrive with a defined problem. Social users may need more education before submitting. That difference affects the page, proof, and offer required, not the basic value of the channel.
Compare campaigns against the right peer group
| Traffic source | Average conversion rate | Performance context |
|---|---|---|
| Paid search | 5.4% | Compare by query intent, offer, and landing-page type |
| AI referral | 5.8% | Treat it as a distinct referral context rather than blending it with search |
| Social organic | 2.23% | Often requires stronger education and trust-building |
| Social paid | 2.11% | Segment prospecting from retargeting before judging performance |
A legal lead form driven by high-intent search should not be judged against broad social prospecting. A solar quote funnel may require qualification fields that a newsletter form does not. Home-services performance can also depend on location, service urgency, and whether the visitor wants a quote, a call, or general information.
Build comparison cells around vertical, source, campaign, device, offer, and conversion definition. If one cell is weak while the others remain healthy, optimize that cell. If every cell is weak, investigate the offer, targeting, tracking, or page promise before changing individual form fields. That structure keeps website, landing-page, and form results from being blended into a benchmark that cannot guide budget decisions.
How to measure and interpret your own conversion rates correctly
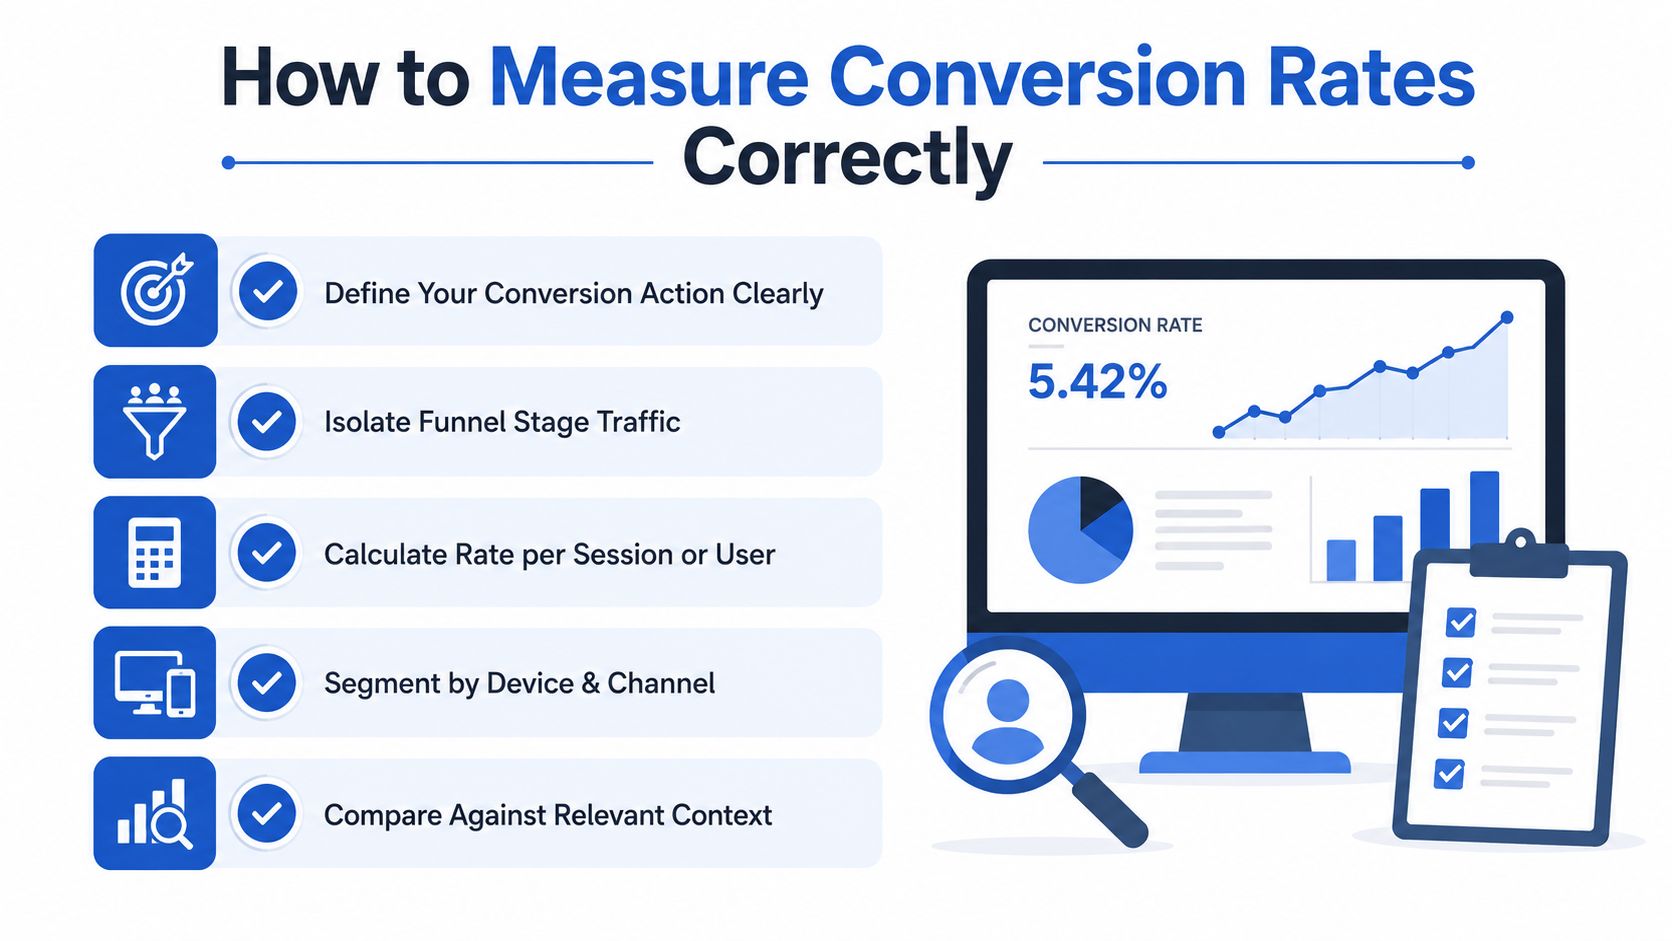
A benchmark is only as reliable as the measurement underneath it. Start by writing the conversion action in plain language, such as “completed quote request” or “qualified lead accepted by the buyer.” Don't group page views, form starts, submissions, booked appointments, and sales-qualified leads under one conversion event.
Build the denominator deliberately
Use a consistent formula for each stage:
Conversion rate = conversions ÷ the eligible population
For a landing page, eligible visitors might be page sessions or unique users. For form completion, eligible visitors are form starters. For lead quality, eligible submissions are the denominator. Keep the definitions stable across reporting periods, otherwise a rate can change because tracking changed rather than because the funnel improved.
Segment before interpreting the result:
- Device: Separate mobile and desktop.
- Source: Keep paid search, paid social, organic, referral, and direct traffic distinct.
- Funnel stage: Track visits, form starts, completions, qualified leads, and accepted leads separately.
- Attribution: Document whether the report uses first-touch, last-touch, multi-touch, or another model.
- Time period: Compare equivalent periods and account for changes in campaign mix.
A form completion rate measured only among starters can sit far above a page conversion rate measured across all visitors. That difference isn't a contradiction. It shows where the funnel loses people.
Watch the walkthrough below for a practical explanation of conversion measurement and optimization.
Don't confuse variance with a real improvement
Small datasets can swing sharply because a handful of submissions changes the result. Avoid declaring a winner from a short burst of traffic or from an audience segment too small to represent normal campaign behavior. Hold the conversion definition, attribution method, traffic allocation, and device segmentation constant while you collect comparable observations.
Then connect front-end rates to downstream outcomes. A higher form completion rate isn't automatically better if qualification falls, buyer acceptance declines, or sales receives unusable records. For lead-generation teams, the useful chain is visit to form start, form completion, qualified lead, accepted lead, and revenue outcome.
The mobile conversion gap and form design impact on benchmarks
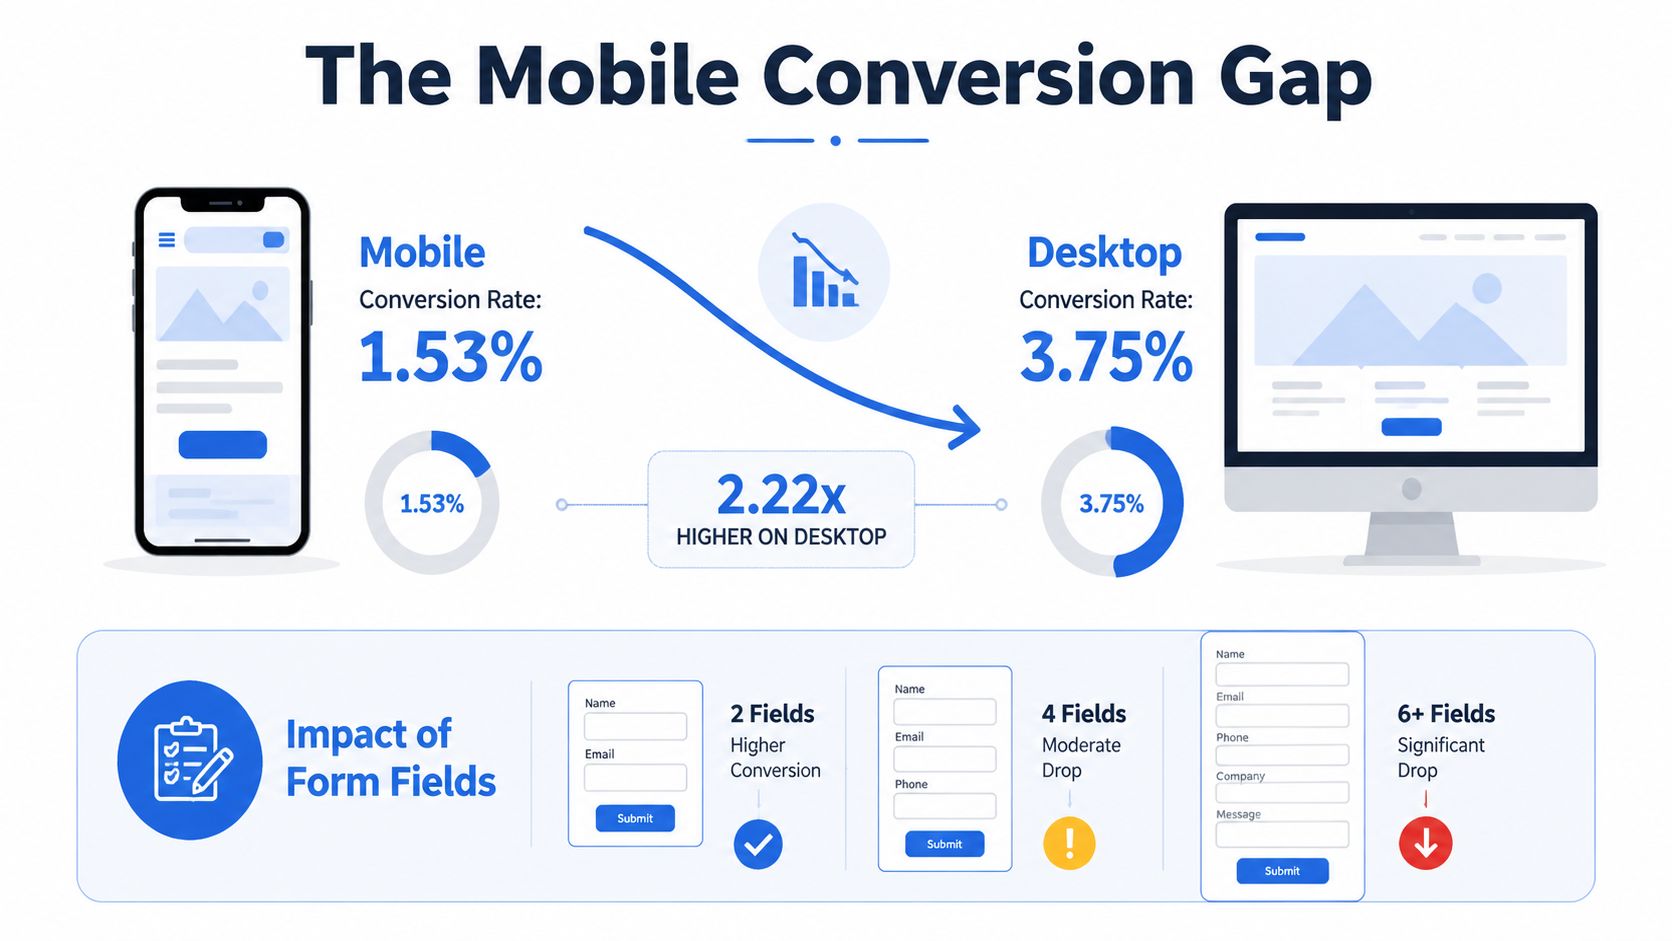
Mobile traffic changes both the benchmark and the likely source of underperformance. Lead-generation forms typically convert noticeably worse on mobile than on desktop, and the gap is widest on longer B2B forms. The gap reflects interaction cost as much as visitor intent.
On a phone, fields compete with limited screen space, keyboard behavior, autofill, and thumb reach. A long static form can make a motivated visitor feel that the page demands full sales qualification before earning a conversation. Mobile form performance therefore belongs in funnel diagnosis, not only in device reporting.
Field count changes the trade-off
HubSpot's analysis of more than 40,000 customer landing pages found that conversion rates fall as form fields are added, though less steeply than many marketers assume, and that multiple text areas and drop-down menus did the most damage. Treat these patterns as directional evidence rather than targets.
Removing fields can raise completion while weakening lead quality. A lead buyer or sales team may need location, service type, or eligibility information to route a submission correctly. Keep a field when it improves qualification, routing, compliance, or follow-up. Remove it when the business cannot use the answer.
Use progressive disclosure
Multi-step flows distribute cognitive load across smaller interactions. Begin with an easy, relevant question, show clear progress, and use conditional logic to hide fields that do not apply. A homeowner requesting a solar estimate should not see questions for another property type, and an unqualified response should not enter the same sales workflow as a viable lead.
For implementation guidance, see mobile form design. Test the live experience on phones rather than relying on a responsive desktop preview. Check keyboard type, error handling, address entry, tap targets, loading behavior, and whether visitors understand what happens after submission.
Actionable steps to improve conversion rates and lead quality
Start with diagnosis, not decoration. A new button color won't rescue traffic that doesn't match the offer, and shorter forms won't solve a broken handoff that loses submissions before sales can respond.
Find the limiting factor first
Use a simple order of operations:
- Traffic mismatch: Compare conversion by campaign, query, placement, and source. If paid search is healthy but social paid is weak, the page may not be the primary problem.
- Offer mismatch: Confirm that the ad promise, page headline, qualification questions, and post-submit experience describe the same next step.
- Page friction: Look for unclear value, weak proof, slow interaction, or a CTA that appears before visitors understand the offer.
- Form friction: Review starts, field-level exits, validation errors, and mobile completion separately.
- Quality failure: Track qualified, accepted, contactable, and revenue-producing leads rather than celebrating raw submissions.
A conditional multi-step form is useful when qualification requires detail but a single long form creates abandonment. Ask the low-friction questions first, then reveal only the fields needed for the selected path. This preserves useful qualification without forcing every visitor through every branch.
Improve the handoff, not only the front end
A conversion has limited value if attribution disappears or the submission arrives late. Preserve campaign identifiers, record consent evidence where required, verify contact details when appropriate, and deliver submissions to the CRM or buyer workflow immediately. That lets you evaluate whether a conversion-rate change improves accepted lead volume, not just form counts.
For teams evaluating capture and testing infrastructure, conversion rate optimization software can sit alongside analytics, CRM, call tracking, and lead-distribution systems. The tool should support the measurement model rather than hide it.
Prioritize tests by business value
Test the largest measurable constraint first. A mobile abandonment problem on a high-volume campaign is usually more valuable than polishing a low-traffic page. Likewise, a modest increase in qualified leads may matter more than a larger increase in unqualified submissions.
Building your benchmark evaluation framework
Create an internal benchmark matrix with one row for each meaningful funnel segment. Include vertical, offer, traffic source, device, landing page, form stage, qualification status, and downstream acceptance. This prevents a strong segment from hiding a weak one inside a blended average.
Set a baseline before launching a test. Record the conversion definition, denominator, attribution model, traffic mix, and lead-quality criteria. Then compare the same cell against its own history and against the closest available external benchmark, rather than against a universal average.
A practical review sequence looks like this:
- Validate tracking: Confirm events, deduplication, source capture, and post-submit delivery.
- Locate the drop-off: Separate page visits, form starts, completions, qualified leads, and accepted leads.
- Segment the gap: Break results down by device, channel, campaign, and offer.
- Choose one hypothesis: Fix the most plausible constraint before adding unrelated changes.
- Recheck quality: Confirm that the improvement survives qualification, contact, acceptance, and revenue review.
Use external conversion rate benchmarks to establish possibility, not permission. Your most valuable target is a reliable rate from the right audience that produces leads your sales team or buyer can use. If the number rises while lead quality falls, the funnel hasn't improved. If the rate remains modest but accepted pipeline improves, the benchmark may have been the wrong goal.
Growform builds the kind of form this article describes. Its multi-step forms open with an easy question, hide irrelevant fields with conditional logic, keep UTMs and click IDs attached to every submission, and deliver each lead to the CRM or buyer in real time. Each completed step can be tracked in Google Analytics 4, so the form stage can be measured separately from the page. Every plan comes with a 14-day free trial, so you can start a free trial and benchmark it against your current form.
Related articles

8 best mobile form builders for lead generation teams
October 1, 2026
A/B Testing for Landing Pages How to Lift Conversions
September 30, 2026
WordPress Multi Step Forms That Convert in 2026
Multi-step forms can convert at several times the rate of single-page forms.
September 30, 2026